
Comment; This is exciting news. Unfortunately however, the test costs $700 and is not currently covered by insurance. The descriptions/explanations for the figures could be a bit more clear, but I understand that this was to be a brief announcement rather than a full explanation–it would be nice to really understand what we’re ordering in order to justify the expense and have a better idea of what advantages this will provide in the daily treatment of chronic inflammatory response and similar syndromes.
Getting to know GENIE (genomic expression by Nanostring: Inflammation explained).
In the end, gene expression, the result of genes in our DNA being turned on or off, remains the fundamental mechanism that lets DNA respond to stimuli from its environment. DNA controls our biology by differential gene activation /suppression. Study of gene activation is called transcriptomics.
Genes are turned on and off to maintain health. If there is no protective host response to disease-producing agents, including environmental stressors, illness will follow. When the DNA responses have done their job, then the gene activation must be stopped, waiting for the next call to arms.
Persistent or unwanted host protective responses can be harmful (Thomas, NEJM 1972 Germ) if the host response involves inflammation. Inflammation is the sum of chemical, cellular and transcriptomic responses to pathogenic organisms and substances. What distinguishes harmful host responses from not-harmful involves the concept of regulation of gene expression. Is a gene overly activated when it shouldn’t be? Suppressed when it should be activated?
We know now that transcriptomics has a unique contribution to diagnosis and treatment of chronic illnesses, as it is here that we see (i) unusual levels of gene activity; (ii) failure of regulation; (iii) and the fundamental changes caused by therapies that lead to correction of pathophysiology. Moreover, by comparing the patient to himself over time; or by comparing cases to controls, we can use transcriptomics as a diagnostic and prognostic tool of far greater sophistication than blood tests (proteomics) alone.
Transcriptomics gives us the ability to see chronic illnesses in a new light, one that has been illuminated over the past several years (ciguatera and VIP) recently by Dr. James Ryan. I have been honored to work with Jimmy for over ten years. GENIE is the direct result of application of his extraordinary transcriptomic observations regarding cellular functions in chronic fatiguing illnesses (CFI). I have not seen anywhere else the breadth of breath-taking observations in the world of CFI that Jimmy has made and validated.
Look at Figure 1 (Preview Ribosomes Over Rx). Across the board, in CIRS, mold, Lyme, CFS and fibromyalgia, for example, using RNA Seq, Jimmy showed suppression of genes of both large and small subunits in patient na�ve to treatment with CIRS modalities. Reproducibly, with CIRS therapies (Consensus statement 5/2018), improvement in suppression follows. Use of VIP provides a final correction and restoration to normal expression levels of ribosomal genes. Stability over time (finished treatment) is a crucial element of evaluation of efficacy of therapy. We call this curve of suppression, correction with overshoot, correction of overshoot and stability off treatment the “CIRS curve.”
Not shown are the identical curves of nuclear encoded mitochondrial gene suppression; and suppression of mitochondrial protein genes (both outer and inner membrane functions). Same responses to therapy; same clinical improvement. Same breath-taking science.
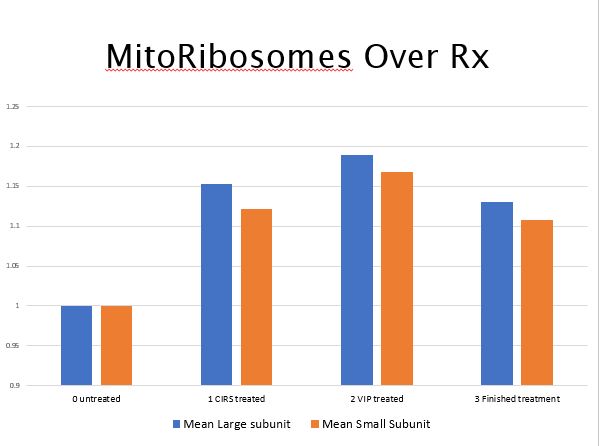
Figure 2, mitoribosomes, shows the same treatment stages and parallel measurements of suppression of mitoribosomes. These smaller subunit structures, like those of prokaryotes, may be uniquely associated with the atrophy of grey matter nuclei seen on NeuroQuant scans in patients with CFI.
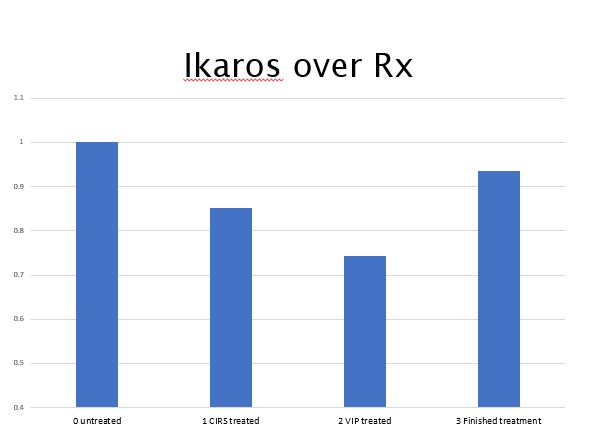
Figure 3, Ikaros, shows the reverse shape of the CIRS curve when we assay nuclear transcription factors in the Ikaros family. Ikaros is regarded as a group of anti-inflammatory genes.
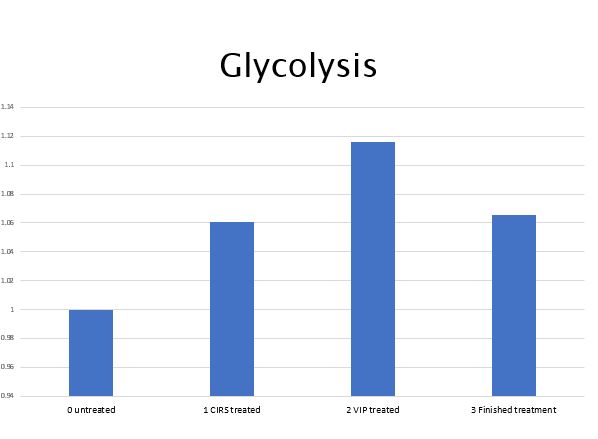
Figure 4, Glycolysis, shows the same CIRS curve, suggesting another aspect of cellular metabolism is also downregulated in CFI.
When combined with the tools of CIRS, following VCS, PASP, VO2 max, NeuroQuant scores and proteomics, GENIE forms a complete diagnostic and prognostic platform that effectively reduces management of complex CFI to correction of abnormalities of stage of Illness. GENIE provides the only known cost-effective method to see reduced cellular metabolism in graphic terms.
As newer facets of transcriptomics develop from accumulation of more data, our understanding of how to best diagnose and treat CFI will improve. For now, though, the advances in management of CFI using transcriptomics and GENIE are here.

- COVID UPDATE: What is the truth? - 2022-11-08
- Pathologist Speaks Out About COVID Jab Effects - 2022-07-04
- A Massive Spike in Disability is Most Likely Due to a Wave of Vaccine Injuries - 2022-06-30
