
https://www.citylab.com/life/2018/04/the-race-to-learn-whats-really-happening-in-the-opioid-crisis/555191/

Cities and towns are on the front lines of an epidemic they don’t fully understand. Their experimental solutions—from real-time maps to sewer robots—highlight how urgent the crisis has become.
Shortly after Thanksgiving in 2016, Cary, North Carolina, realized it had an opioid problem. Five overdoses were reported that week. Three were fatal.
“That weekend hit home that Cary is not an island, that we have all the same social problems as everywhere else,” deputy town manager Mike Bajorek said. “Sometimes you just need that one pivot point to say, ‘Hey, we need to do something.’”
The city knew it had to act fast. As overdoses spiked 70 percent the next year, officials realized they didn’t have enough information about the extent of the problem to create targeted initiatives.
The thing is, there’s more to the opioid epidemic than death statistics, and even those can be unreliable. With a lack of detailed, up-to-date data, cities are waging their own digital war to learn what’s really happening in their communities. Cary, for one, is going underground—to mine data from the sewage.

Down the drain
Cary will be the first in the U.S. to tackle opioids through something called sewage-based drug epidemiology. The field is relatively new, but it’s increasingly being employed across the globe to find traces of substances like marijuana and cocaine in human waste. With a $100,000 grant from Bloomberg Philanthropies’s Mayors Challenge, Cary officials have partnered with the MIT-affiliated company Biobot to deploy small robots into the sewage system to collect samples of the city’s waste. The samples will be measured for their concentration of opioid metabolites, which get flushed out of bodies after opioid consumption.
The devices will extract samples from the 200,000 gallons of wastewater that flow through each sample area—gathering information for areas of roughly 5,000 homes each. That will help researchers determine a baseline level of opioid consumption.
“From there, we can identify significant changes in that consumption, and in which part of the city,” Biobot cofounder Mariana Matus said. “We can also tell the main type of drug driving those dynamics—is it more prescription or illicit opioid?” Metabolites are like fingerprints; each drug produces a unique kind after it’s consumed.
The science first made headlines in 2005, when researchers in Milan studied the concentrations of cocaine residues in Italy’s Po River. What they found was equivalent to about 40,000 daily doses, or about 27 doses for every 1,000 people. The findings far exceeded official estimates, which indicated just 15,000 doses per month. Cary’s project is expected to reveal a similar disparity.
The city plans to combine the results with existing data. “We’ll know specifically, from census data, what are the demographics of the area, the social, economic, and land use,” Bajorek said. “We’ll answer questions like how far is the nearest park or greenway? What’s the unemployment [rate], and how many people are insured?”
Cary’s opioid problem hasn’t quite reached the critical levels seen in other North Carolina cities. In Wilmington, home to some 117,500 people, police responded to more than 500 overdoses in 2017. Bajorek knows, though, that his city could very well be catching up. North Carolina is grappling with one of the nation’s worst opioid crises, with related deaths jumping from fewer than 200 in 1999 to nearly 1,400 in 2016, according to official records. Data also shows that the state administered naloxone, an overdose-reversing drug, more than 13,000 times that year. In 2016, one report showed that four North Carolina cities, including Wilmington, made it to the list of the nation’s top 25 cities for opioid abuse.
“Because we are not in a reactive or crisis mode, we can be proactive,” Bajorek said. Ultimately the city plans to make the results from the sewage study public, with the hopes that other analysts and nonprofits can put the information to good use. If the pilot proves to be successful, they hope to share their story with other cities that are desperate for solutions.
Getting the right numbers
A recent examination of Centers for Disease Control and Prevention data, performed by University of Virginia economist Christopher Ruhm, estimates that states may have undercounted opioid deaths by 20 to 35 percent between 1999 and 2015. That translates to thousands of deaths each year.
Much of the disparity can be attributed to how death certificates are filled out at the state level, and differences from one state to the next, Ruhm said. Several states don’t require certificates to list the specific drugs involved in deaths. Ruhm found that in one-sixth to a quarter of overdose deaths recorded in those years, no drugs were listed at all.
He developed a prediction model based on the details of confirmed opioid-related deaths. When corrected, the number of deaths in 2015 rose from 33,091 to 39,999. That’s nearly 7,000 deaths potentially not accounted for. In a previous study, he found the death rate in Pennsylvania, Indiana, Louisiana, and Alabama may be more than twice as high as what’s reported.
Insufficient data is troubling. For one thing, those numbers determine federal and state spending on initiatives to combat opioids. But for researchers like Ruhm, and for local policymakers, there’s a larger problem. “If you don’t have good data, you don’t necessarily have information on the nature [of the epidemic],” including the age, race, and location of people affected, he said. “If we’re going to try to target policy, you need some of those nuances.”
Even Cary’s method has its limits. The results won’t reveal where the drugs are being used with any specificity, or how they’re distributed among the surveyed population. And with finer-grain detail comes ethical and privacy concerns. Bajorek and the Biobot cofounders said the very design of their analysis—studying a few molecules from hundreds of thousands of gallons of water—makes it impossible to trace anything back to a particular neighborhood, let alone an individual. Plus, Bajorek said, the intent isn’t to find “hotspots.” They’re more interested in finding correlations.
Putting the crisis on the map
In an ideal world, real-time data could monitor spikes as they occur. But there’s a lag time when it comes to releasing official numbers; the most recent confirmed data on opioid-related deaths, which largely depend on toxicology reports, is from 2016. And even preliminary data can be months old.
CDC’s National Syndromic Surveillance Program tracks hospital and emergency room visits that are suspected to be opioid related, but that’s limited by hospital participation and lack of data sharing across jurisdictions.
Yet data sharing is key, especially when it comes to proactive measures like tracking where drugs are coming from, and where they’re going next, according to Jeff Beeson, the deputy director and chief of staff for the Baltimore/Washington High Intensity Drug Trafficking Area—a program created by the National Institute on Drug Abuse to combat drug trafficking.
“When we look at the drug threat we’re facing [in the Washington, D.C., region], they’re coming up through the southwest border, sometimes through New York and New Jersey and into Baltimore City,” he said, adding that Baltimore City is a distribution point for drugs into neighboring cities. “If we look at the [pattern of] overdoses in Baltimore City, we’re able to track [the drugs] and establish sort of a warning system when spikes occur.” That, of course, requires cities to share their data, and in real time.
That was, in large part, the idea behind the syndromic surveillance program Beeson and his team designed. The Overdose Detection Mapping Application Program, or ODMAP, harnesses technology like ESRI’s mapping services to bridge the gaps left behind by traditional efforts.
For one thing, it doesn’t take the term “real time” lightly. In 2016, the agency equipped first responders with a mobile app to document suspected overdoses as they were responding to them—and on location. On the other end, public health and law enforcement officials could watch as dots popped up on an interactive map. Each dot represents one victim, and each is color-coded to indicate whether it was a fatal case and whether naloxone was administered.
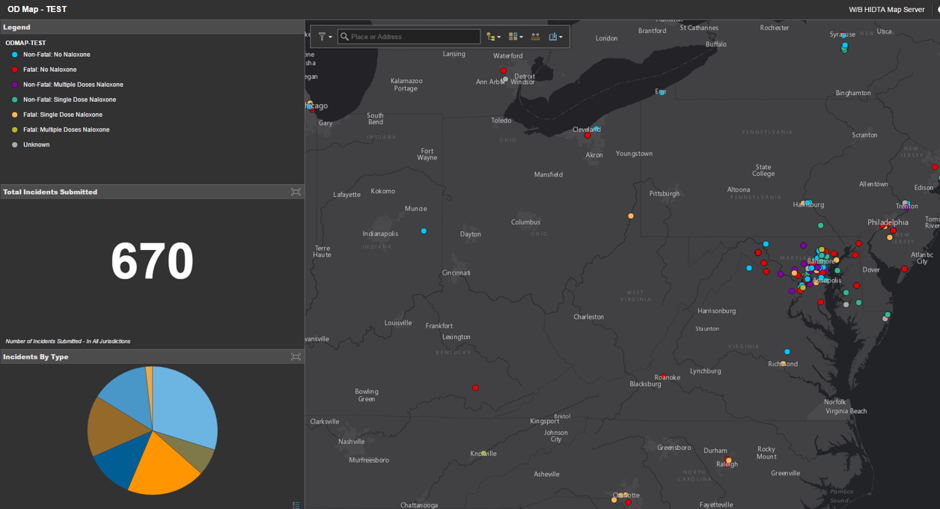
”Right now, I can take a look—because first responders responding to an overdose scene are instantaneously putting data into the system,” he said. “Takes them two seconds to log into the app, and it uploads immediately.”
By adjusting the filters, agency staff can zero in on, say, all the nonfatal cases over a week, or a year, or even over the last 24 hours. They can look for clusters within a city or within a neighborhood, or—because the team has so far partnered with more than 250 agencies across 27 states—around the nation. The hope is that analysts can eventually detect where batches of opioids are entering a city from, and address the issue at the source. And that officials can predict where the next spike will be and get a head start organizing initiatives.
Pinpointing the solution
While advancing technology to measure the toll of opioids certainly has its value, stopping their spread also means getting victims treated as soon as possible. And for many cities, that’s yet another challenge.
In eastern Maryland, Anne Arundel County’s fire departments and police stations will become 24/7 “safe stations,” where addicts can seek guidance and, more importantly, immediate treatment. Officials in Anne Arundel had expected roughly five people to use the program each week. Five months into the program they were seeing triple that estimate. Herein lies the problem, especially for Annapolis, where the rate of overdose surpasses the county’s average of 18 per every 100,000 people: Heavy traffic, and at all hours, meant responders were struggling to find available beds at treatment centers.
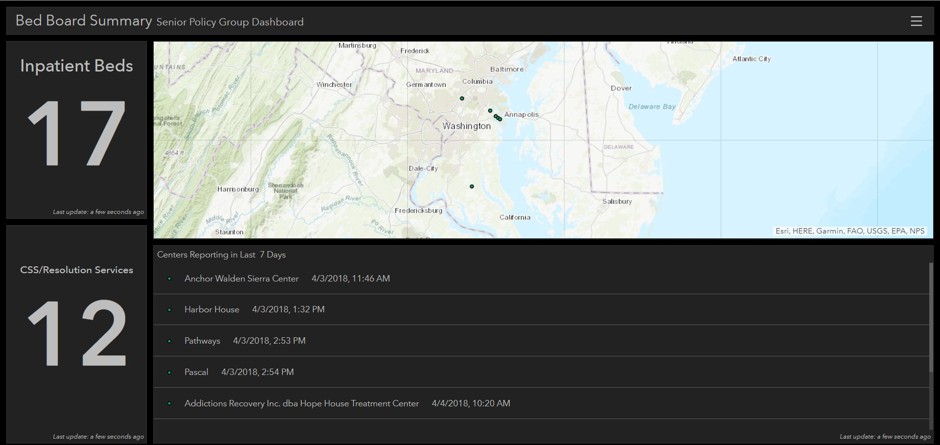
“We don’t want people who go into a safe station and have to wait so long for a bed that they walk out,” Hudson said. “They have to be in their right state of mind to come in there in the first place, and for them to not get the help that they need is just a disservice to them.”
She added that everything gets archived, including information that the centers put in about staff shortages and other resource challenges. That will be presented to policymakers as evidence for the need for more funding.
From harnessing mobile apps to sending robots into the sewers, these experimental solutions highlight how urgent the opioid crisis has become. “Ideally the national government would set a framework so that we get consistent data, and cities will implement those frameworks,” said Ruhm, and not just for monitoring opioids. “It’s a broader drug epidemic in ways that aren’t getting enough attention.” But between funding and resource challenges, various privacy laws, and lack of data-sharing, that ideal world hasn’t come to fruition. And cities, which are at the front lines of the epidemic, have to fill in the gap.
Comment;
Somebody really had their head screwed on straight to come up with all of these mapping apps and techniques! Sheer genius!

- COVID UPDATE: What is the truth? - 2022-11-08
- Pathologist Speaks Out About COVID Jab Effects - 2022-07-04
- A Massive Spike in Disability is Most Likely Due to a Wave of Vaccine Injuries - 2022-06-30